[NOTE ABOUT A RECENT MINOR HACK:
The apparent link to porn sites that appeared below the menus and led to a “404 Page not found” message should have been deleted thanks to a useful application called SiteLock that removed the malware.]
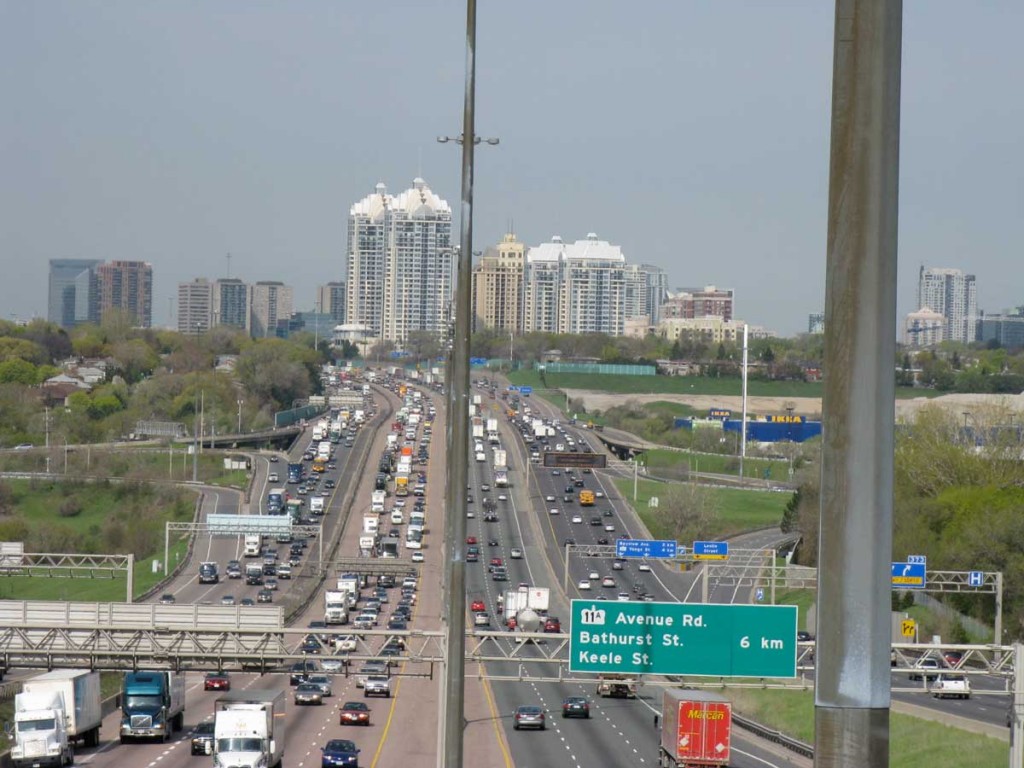
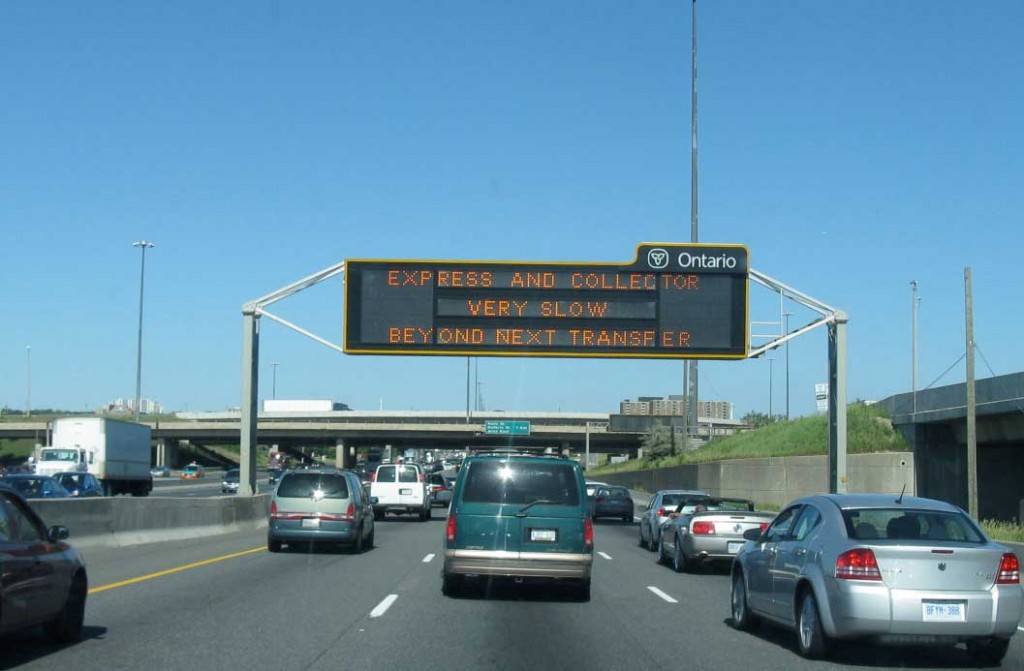
A few days ago I was driving in heavy traffic on Highway 401 near the airport when a factoid sprang to mind – At any given moment about 500,000 people in the world are in the air, flying somewhere. The follow-up question came almost immediately.
At any given moment, how many people in Toronto are in vehicles, on their way to somewhere?
Clearly, given all the cars and trucks on the fourteen lanes of the 401, that number is considerable. Add in traffic on other expressways and the streets of the City and the inner and outer suburbs of the GTHA, plus passengers on buses and the subway, and it was not difficult to guess that it might well approach half a million.
So I went digging for information. While I don’t know of any count of vehicles in the region, the most recent StatsCan figures (for 2104) put the population of the GTHA at 7,204,000 (Toronto CMA 6,055,000, Oshawa CMA 384,000, and Hamilton CMA 765,000). There are about 2,000,000 households, and it doesn’t seem unreasonable to assume that on average each household has at least one vehicle.
The Ontario Ministry of Transport has traffic volumes for Provincial highways, including expressways, up to 2010 for Annual Average Daily Traffic (AADT). The City of Toronto “Signalized Intersections Vehicle and Pedestrian Volume” has data for an 8 hour period (usually 7:30 am – 6:30 pm with breaks) for 296 intersections, plus TTC Ridership – All Day Weekday for Surface Routes, (buses and streetcars), and TTC Ridership Subway and LRT. Peel Region has data for 298 stations. Durham Region has data up to 2012 for about 350 stations. York Region has a business like approach and charges an administrative fee for data on traffic flows, so I don’t have York’s counts!
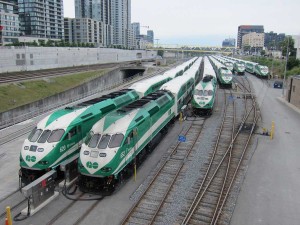
These data have been collected in different ways at different times by different agencies, and of course a single vehicle can be counted several times as it moves through the city, but together they can give a broad approximation of how many people are usually in a vehicle on the move in the Toronto region. Incidentally, I have included neither GO transit nor regional transit systems in this rough estimate, which I think is, if anything, low.
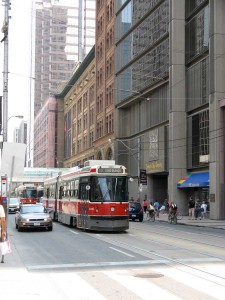
My estimate is that at in any given 15 minute period during a business day about 350,000 people in the GTHA are on the move in cars or trucks. Another 40,000 are on the subway, buses or streetcars. That’s a total of almost 400,000 people on wheels going somewhere any time during a weekday.
To put this in perspective, even though 400,000 is an enormous number, it is just under 6 per cent of the 7.2 million population of the GTHA, a substantial majority of whom are commuting to work or college or school every day, or going shopping or to visit friends. It is nevertheless a salient reminder of the fact that cities are places in a sort of constant Brownian motion, albeit sometimes very slow motion, as much as they are places of streets and buildings and spaces.
Here’s my rough and ready method of calculation
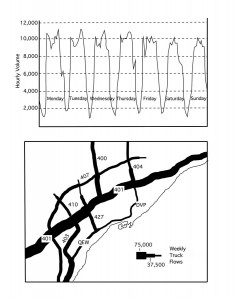
Pulses in Traffic Flows on Hwy 401 and Expressway Traffic (from Toronto:Transformations in a City and Region)
I took the Average Annual Daily Traffic flows from the Provincial data for one point in the GTHA for each expressway, and divided them by 24, to get a vehicles per hour number. Because traffic flows pulse over the course of 24 hours – high during the day and low at night this number is actually quite conservative. I did the same with data from the various Regions. For the City of Toronto Signalized Intersections data I first divided by 8 to get an hourly count, but presumably a lot of vehicles will pass through several intersections within an hour and there is double and triple counting, so I divided again by 4 to get a 15 minute count.
Here are the Provincial AADT numbers:
QEW (section near the Gardiner) 179,000
401 (at Islington) 403,000
403 (Hurontario) 205,000
404 (Sheppard) 302,000
409 (near 401) 82,000
410 (near 401) 110,000
427 (Eglinton) 356,000
Hwy 5 27,000
Hwy 6 12,500
Hwy 7 26,500
Hwy 10 21,300
Hwy 11 40,600
DVP 180,000
That’s a total count of 1,945,000 vehicles per day, or 81,000 per hour, though as you can see from the graph of pulses, the number during the day is much more than that. I assumed most expressway trips take about an hour and did not divide further.
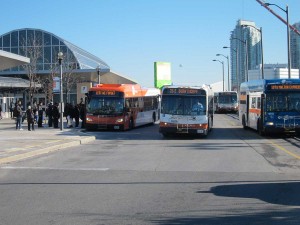
Buses at Square One Terminal, Mississauga City Centre. I did not include regional transit systems in my count.
Peel has 298 stations with a total 2014 traffic flow count of 2,919,000 vehicles or 121,625 per hour – these stations are close together so I divided by 4 to get a 15 minute count of 30, 406.
Durham has 360 stations, but the data is on a pdf and there is no quick way to total flows. Numbers at individual stations on some key busy roads (Bayly, Westney, Thickson, Brock, Simcoe, Taunton, Whites, Altona and Highway 2) totalled 270,000 – or 11,250 per hour.
The City of Toronto 8 hour count at 295 signalized intersections totalled 5,510,296 vehicles (18,679 per intersection) – for a one hour total count of 688,000 vehicles. Because many of the intersections are close together individual vehicles will have been counted several times, so I divided this by 4 to get a 15 minute count, which is 172,000. The TTC numbers are for typical business day ridership (surface routes 1,666,000; subway 1,300,000 arriving platform usage; I took the totals and divided by 18 (assuming very low ridership for six hours at night), and then by 4 to get a 15 minute count.
A final, sobering, note. The City of Toronto Signalized Intersections survey also counted pedestrians. There were 572,841 pedestrian movements compared with 5,5510,000 vehicles – a ratio of vehicles to pedestrians of 10:1; only in the heart of downtown do pedestrians outnumber vehicles, and even there only at a few intersections.
